Visualizing GitHub in Real Time on My Homepage
I was building out my personal site and wanted the background to feel alive. Not a canned CSS animation, but something tied to real data that’s constantly changing. Since I spend most of my time writing code, GitHub was the natural data source. The idea: visualize real-time GitHub events as falling rain, where each drop represents an event type (push, PR, fork, star, etc.) with its own color and a random size.
If you’re reading this on my site, the rain is falling behind this text right now.
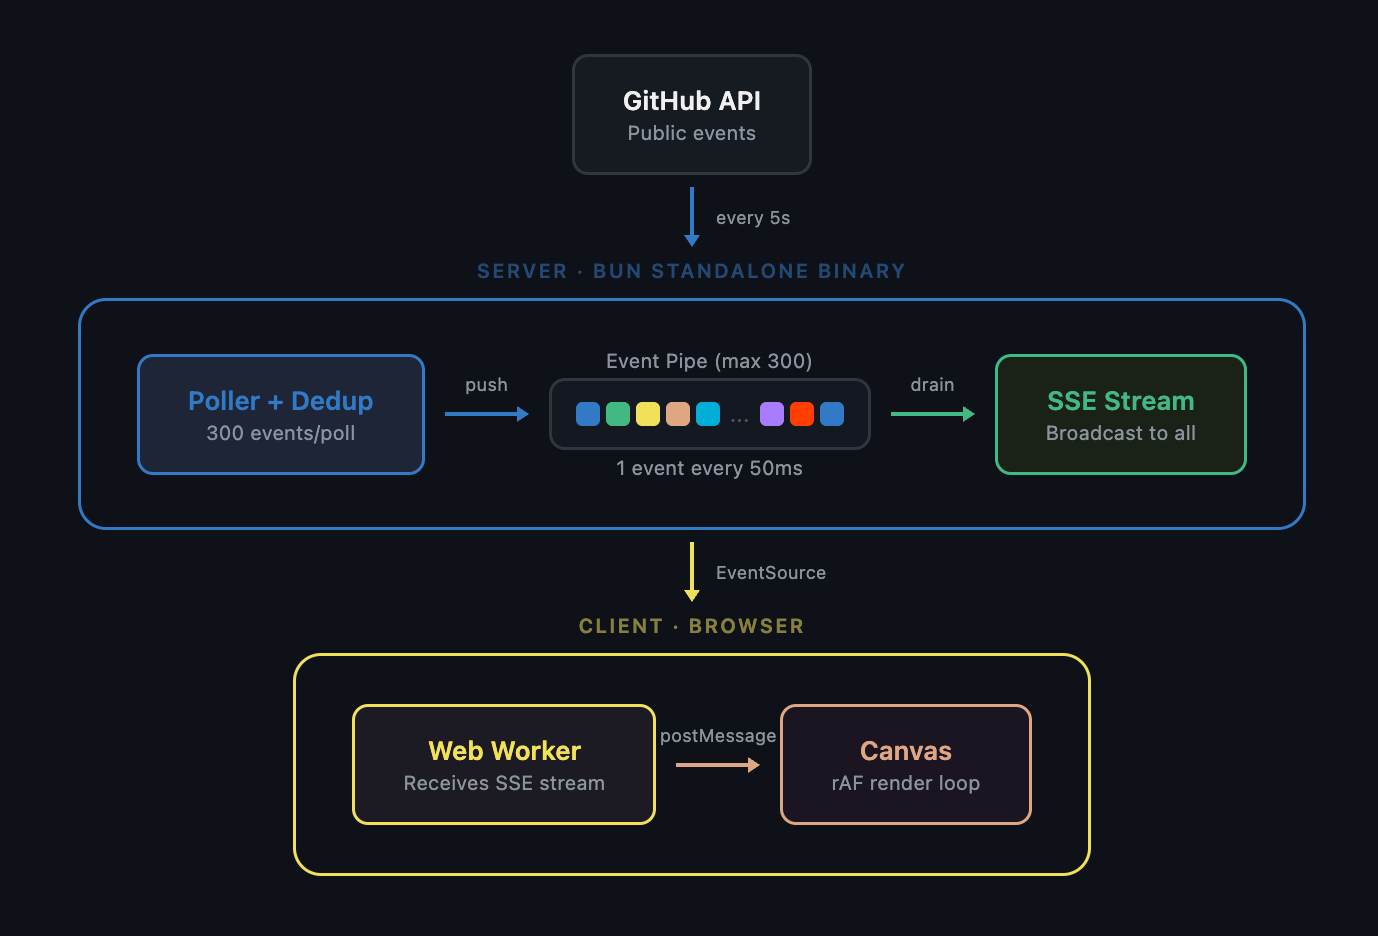
Here’s the high level overview of how it all fits together:
The data problem
GitHub’s public events API gives you a firehose of everything happening on the platform. Pushes, PRs, stars, forks. But unauthenticated requests are capped at 60 per hour. Authenticated requests get 5,000/hr, but you can’t expose a token in client-side JavaScript.
The proxy
A Bun server on a Lightsail instance, fronted by Cloudflare. It polls GitHub’s events API every 5 seconds (3 pages in parallel, 300 events per poll), deduplicates, and pushes new events into a bounded in-memory queue. The queue always drains, even with no clients connected, so it stays fresh.
Clients connect via SSE (Server-Sent Events). The server drains one event every 50ms and broadcasts it to all connected clients. Each event carries a color mapped to its type and a random size ratio. The whole server uses about 48MB of memory at runtime.
The server is compiled into a standalone binary using Bun’s --compile flag, cross-compiled for Linux on my Mac. The deploy script uploads it over SSH and restarts the systemd service. No Docker, no packages to install on the box. The binary has zero runtime dependencies.
The front end
A Web Worker opens an EventSource connection to the proxy’s SSE endpoint and forwards each event to the main thread as a drop message. The renderer is a <canvas> element behind the page content. A requestAnimationFrame loop manages the drop state, adapting to device capability: 30fps on mobile, 60fps on desktop.
The details
Each drop’s length scales with the size ratio from the server. This gives a natural mix of long and short drops.
Drops don’t fall at constant speed. They accelerate under gravity and cap at a terminal velocity proportional to their mass (width × length). Heavier drops fall faster, just like real rain.
There’s a constant wind generated randomly when you load the page. Every drop drifts in the same direction, but lighter drops drift more and heavier drops resist. Reload and the wind might blow the other way.
The drop shape tapers. Thin tail, broad head, with each segment angled slightly by the wind, creating a natural curve rather than a straight line.
When a drop hits 95% of the viewport height, it doesn’t just disappear. It splashes, an expanding ellipse that flares out and fades, sized proportional to the drop’s width.
Opacity increases with velocity. A drop that just spawned and is still accelerating appears faint. As it picks up speed, it becomes more solid. A subtle motion blur effect.
None of these are individually dramatic. Stacked together, they make the rain feel like rain.
The whole thing runs on a $5/month Lightsail instance. No Lambda, no managed services, just a single binary and a systemd unit file.